PMS trend analysis - a complex issue where you cannot fail
Trend analysis is a legal obligation of all medical device manufacturers, especially in "post-market surveillance."
Manufacturers must not fail in the selection and application of suitable statistical methods for trend analysis. This is because the focus of authorities and notified bodies is increasingly shifting to monitoring post-market activities.
This article provides a quick introduction to this complex topic, outlines the legal obligations, and offers seven concrete tips for implementation. It also lists the seven most common mistakes that manufacturers should avoid at all costs.
1. Summary for readers in a hurry
a) Whom the trend analysis in post-market surveillance concerns
The following roles need to help identify, assess, and respond to trends in the post-market phase:
- Individuals responsible for post-market surveillance, e.g., in product management and customer support
- Risk management staff
- Quality management representatives
- Persons Responsible for Regulatory Compliance (PRRC)
- Employees in medical or clinical affairs
b) Why trend analysis is important in PMS
Trend analysis is relevant for medical device manufacturers in post-market surveillance (PMS) to
- meet the regulatory requirements for it, respectively
- prevent regulatory hassles in this context and, if necessary, delay "approval" of the devices,
- to identify problems with its own devices at an early stage,
- thereby ensuring patient safety, and
- to avoid a loss of reputation or even penalties.
c) What the roles need to know and do
These roles must
- understand the regulatory requirements,
- specify what data they collect and at what frequency, and
- what statistical methods will they use to analyze this data and calculate trends,
- set threshold values for the trends and check if they are exceeded, and
- decide whether reporting to the authorities is necessary.
In addition, manufacturers must specify these activities in procedure and work instructions and document the outputs of these activities, e.g., in reports.
Attention
This article is not about the analysis of market trends and the prediction of market developments. Rather, it describes the application of statistical methods to evaluate time series of post-market data and to identify emerging (problematic) developments.
2. Regulatory requirements
a) Overview
Many regulatory documents have requirements for trend analysis (see Tab. 1).
Requirement | MDR (IVDR) | ISO 13485 Chapter | ISO 14971 and ISO 24971 | Others |
Determine which data is collected and how often | Annex 3 Part 1.1 | 8.2.1, 8.4 | 10.1 | 21 CFR 803.17 |
Systematically collect data according to this plan | Article 88 (83) | 8.2.1, 8.4 | 10.2 | 21 CFR 803.17; IMDRF |
Identify incidents | Article 88 (83) | 8.2.2 | 10.3 |
|
Determine and justify methods for statistical evaluation and trend analysis | Article 88 (83) | 8.4 | 10.3 (ISO 24971) | 21 CFR 803, IMDRF |
Statistically evaluate frequency of incidents according to plan, identify trends | Article 88 (83) | 8.4 | 10.3 (ISO 24971) | 21 CFR 803.53, |
Set threshold values | Annex III, Part 1.1 |
|
| |
Check the acceptability of the risks | Article 88 (83) | 8.2.1 | 10.3 | 21 CFR 803.10 |
React when threshold values are exceeded (corrective action, reporting to the authorities) | Article 88 (83) | 8.2.2, 8.2.3, 8.3.3, 8.5.2 | 10.4 | 21 CFR 803 |
Identify causes of problems |
| Among others 8.5.2 |
| 21 CFR 803 |
Tab. 1: Regulatory requirements for trend analysis
b) MDR / IVDR
The legal requirements of the EU MDR and IVDR regulations are very precise.
Obligation to report already in case of statistical increases leading to unacceptable risks
Manufacturers shall report (…) any statistically significant increase in the frequency or severity of incidents that are not serious-incidents or that are expected undesirable side-effects that
- could have a significant impact on the benefit-risk analysis (…) and
- which have led or may lead to risks to the health or safety of patients, users or other persons that are unacceptable when weighed against the intended benefits.
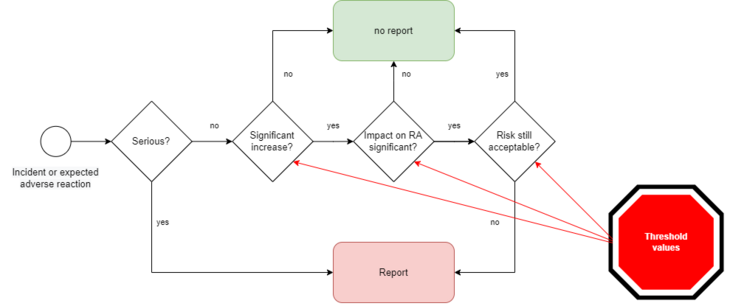
The MDR and IVDR thus oblige manufacturers to find out whether the assumptions in the risk management file are still correct. If this is no longer the case, they might have to report even non-serious incidents (Fig. 1).
Note
The requirements of the IVDR in Article 83 are largely identical. However, it adds:
"... or of any significant increase in expected erroneous results established in comparison to the stated performance of the device [...]."
Obligation to perform static analysis and set thresholds
MDR and IVDR require manufacturers to plan for post-market surveillance.
b) The post-market surveillance plan shall cover at least:
– suitable indicators and threshold values that shall be used in the continuous reassessment of the benefit-risk analysis and of the risk management as referred to in Section 3 of Annex I
These two requirements result in the following:
1. Manufacturers must constantly check whether their risk management assumptions are still correct on the basis of the collected PMS data.
2. They must set threshold values in accordance with the risk policy and check whether these are exceeded and, if necessary, take corrective and preventive measures.
3. If these values are exceeded to the point where the benefit-risk ratio is no longer acceptable, they must report this identified trend to the authority.
Attention
This reporting requirement is independent of the vigilance cases that manufacturers must always report.
Thus, several decision steps are necessary (see Fig. 1):
1. is the "increase in severity of non-serious incidents or expected undesirableside-effects" significant?
2. is the impact on the benefit-risk ratio significant?
3. is the risk-benefit ratio still met?
Which methods are helpful in making the decision and whether changes are significant is described in this article below.
3. Definitions of terms
a) “trend“
MDR and IVDR use the term "trend" but do not define it. Therefore, it is helpful to use other definitions of the term.
Definition: Trend
Statistically detectable development (tendency) already observable over a certain period of time.
Source: Duden (German)
b) “statistically significant“
In contrast, EU regulations define when an increase is "significant:"
The significant increase shall be established in comparison to the foreseeable frequency or severity of such incidents in respect of the device, or category or group of devices, in question during a specific period as specified in the technical documentation and product information.
Article 88 MDR
This, in turn, means that one should compare the actual values for probabilites and severities of risks with the originally assumed values in the risk analysis. How large this difference may be and when measures are taken must be specified by the manufacturers via the threshold values. There are several methods to specify these thresholds. They are described below.
4. Procedure for trend analysis
Attention
All activities described below must be described by the manufacturers in work and standard operating procedures.
a) Determine what data to collect
Set data sources
EU regulations, ISO 13485, ISO 14971, ISO 24971, and ISO/TR 20416 provide more specific guidance to manufacturers. Manufacturers should not only collect and evaluate customer feedback; other data sources include:
- Authority databases
- Log files
- Scientific literature
- Standards and guidelines
- Installation and service logs
- Customer surveys
Further information
For an overview of the data to be collected, see the articles on Post-Market Surveillance and the ISO-20416-compliant Post-Market Surveillance Plan.
Set attributes
Manufacturers should determine not only the data sources but also the attributes they want to capture per record. For example, customer complaints can be documented using the following attributes:
Attribute | Purpose, objective |
Date | Set up time series |
Unique device identification (e.g., via UDI) | Determine product type and other dependent attributes |
Type of hazard | Decide on reporting obligation |
Probability and severity of possible harm | Decide on reporting obligation |
Place of use of the device | Find out the cause of the problem (e.g., use environment) |
Production line in which the device was manufactured | Find out the cause of the problem (e.g., production) |
Person who has identified the problem | Finding out how well "quality gates" work |
Tab. 2: Examples of attributes for capturing data
Which attributes the manufacturer records depends on the objective. This should be described in the respective standard operating procedure, e.g., in the complaint management process.
Specify frequency of data collection
Manufacturers are required to specify the frequency of data collection. This depends on the type of device, the technologies used, and the questions to be answered (see Tab. 3).
Data to be collected | Frequency considerations |
Customer feedback | Feedback initiated by customers must always be immediately evaluated in order to identify serious incidents. The statistical evaluation of processed further feedback can then be carried out on a periodical basis, e.g., quarterly. The frequency of customer surveys depends on the objective. |
NIST Cybersecurity Database | This data should be collected and pre-evaluated continuously and thus automatically. If this is not (yet) possible, a weekly frequency is recommended. (Note: UL 2900-2-1 requires that patches are rolled out after two weeks). |
Authority databases | Typically monthly |
Clinical literature on the state of the art | Typically annually |
Tab. 3: Examples of the frequency of data collection
Note
The frequency of data collection also determines how quickly trends can be identified.
b) Set objectives of the evaluation
The laws already determine the minimum set of questions for which the manufacturers must evaluate the data.
- Are the assumptions regarding the probability and severity of harm (e.g., adverse reactions) correct?
- Are there hazards that were overlooked in the risk analysis?
- Do the risk acceptance criteria still reflect the state of the art?
- Are the risks still acceptable, given the benefits?
- What are the causes of the problems? (Design flaws, production flaws, material flaws, suppliers, problems with storage, transportation, installation, maintenance, etc.)
- What are the usability problems (e.g., use errors)?
- Is there an off-label use of the device?
For these questions, manufacturers must also monitor trends and decide if there is a statistically significant increase.
c) Specify methods for evaluation
General
In order to be able to detect statically significant changes, manufacturers must use appropriate methods (plural!).
Based on the diversity of the medical devices in the market it is not meaningful to define a single trending procedure valid for all devices.
Source: Manufacturers Trend Reporting of Adverse Events, IMDRF/GHTF
Many methods are available for trend analysis:
- Regression
- Weibull analysis (recommended in ISO 24971)
- Nelson Rules (recommended in ISO/TR 20416)
- Mann-Kendall test
- Neumann trend test (for normally distributed populations)
The choice of method(s) always depends on the research question.
Further information
ISO/DIS 10017 (buy cheap here) is recommended by ISO 24971. It is entitled "Quality management - Guidance on statistical techniques for ISO 9001:2015".
In the pharmaceutical environment, such trend analyses have been common practice for decades. Accordingly, one will find what one is looking for in the literature there, such as in the book Static Methods of Trend Analysis.
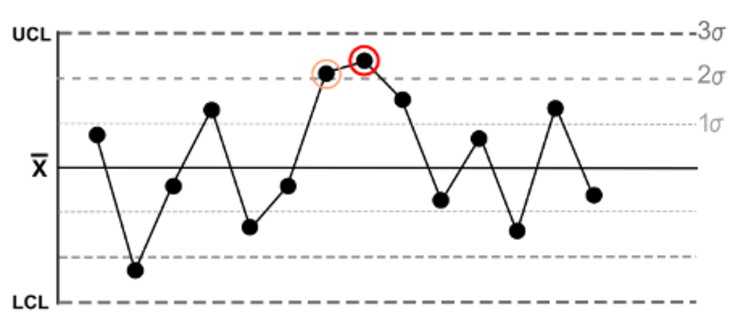
Here is an example from the "Nelson Rules": The fifth rule states that a trend exists if there are two or even three points in a series that are more than two standard deviations away from the mean in one direction (see Fig. 2).
Tip
Benefit from the support of the Johner Institute's post-market team to create or review your PMS plan and all the methods it specifies specifically for your devices. So, you can pass the next audit with ease.
Get in touch here.
Determine if there is a reportable increase
According to the MDR/IVDR, significant increases in the frequency or severities of potential harms must be reported if they "have a significant impact on the benefit-risk-determination and could lead to unacceptable risks" (see also Fig. 1).
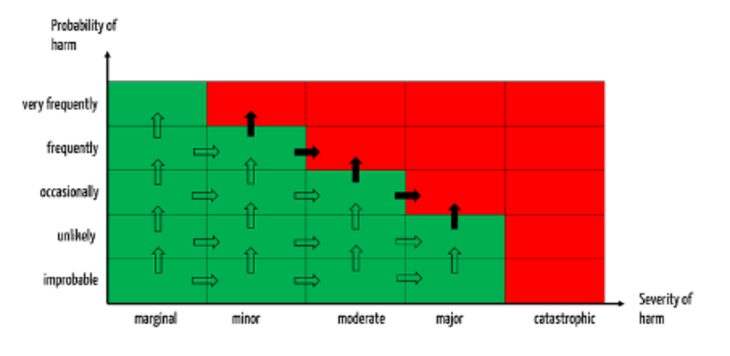
A change is considered significant if it causes severities or probabilities to fall into a class other than that assumed (all arrows in Fig. 3).
Such a change is reportable if the associated risks move into the unacceptable range (see black-filled arrows in Fig. 3).
Tip
In this approach, defining the thresholds, as shown above, is helpful: A trend is significant if the probability of potential harms (or associated severities) falls into a class higher than the assumed class.
This is easier than using complex statistical procedures to identify trends and set thresholds.
If enough data is available, averages (e.g., monthly) can help smooth out short-term fluctuations.
Check with the PMS experts at the Johner Institute to see how they can review your PMS plans and give you specific advice for improvement. They will also help you evaluate your data.
Contact us right away via the web form with a suggested appointment for a free, non-binding consultation.
5. Dealing with special cases
a) There are only a few devices on the market
When products are new to the market, or there are only a few instances of a device on the market, there is no data basis for many statistical procedures. Trends can hardly be derived from individual data points.
Then, depending on the risk, manufacturers have to make an increased effort to collect data:
- Participatory observations of usage in the field
- Active questioning of users
- Evaluation of log files at short intervals
- Analysis of comparable devices and technologies
Attention
MDR and IVDR require a proactive approach. It is not in compliance with the law, especially for devices with high risks, to simply wait until sufficient data is available for trend analysis.
ISO 20416 also allows for qualitative consideration. The Johner Institute has included this in PMS plans for many manufacturers, which has been accepted by notified bodies.
b) Devices are already discontinued
If devices are discontinued, evaluations based on sales figures are no longer useful. It is generally better to standardize the values on the basis of usage.
If no information is available on this, the question arises as to whether the manufacturer is adequately fulfilling its obligation for post-market surveillance.
6. Recommendations for trend analysis
a) Seven valuable tips
The following seven tips will help manufacturers with statistic evaluation and trend analysis.
Tip 1: Use the concept of continuous improvement
Don't overcomplicate anything. It is better to start with only one method for evaluation than not to start at all. For example, you can largely meet the regulatory requirements with the procedure described in the second part of chapter 4 c).
Once you have established this evaluation procedure, you can add more data, methods, and evaluations to learn more about your devices (and users).
Tip 2: Think from behind
Many manufacturers feel overwhelmed by the amount of data. If you don't know which data to collect and evaluate with which priority, think "from behind," i.e., starting with the patients.
To do this, think in terms of a fault tree analysis of which events/hazards could endanger the safety of the patients. In this way, you get an idea which data give an indication of these events/hazards. Start with this data.
Also, look at the clinical evaluation recommendations: here, there should be an indication of what data are essential to capture in post-market surveillance or post-market clinical follow-up.
Tip 3: Use the IMDRF codes
The IMDRF has developed numerous codes that you can use to code problems, causes, etc., across the organization. These codes are required in reports (e.g., the PSUR). Therefore, use these codes from the beginning of your data collection and processing.
Tip 4: Learn more about your company and your devices
Don't think of collecting and analyzing data as a chore required by law. Trend analyses help you learn more about your company, your devices, and your customers and support necessary decisions.
You'll get relevant answers to questions like:
- How do your products and product variants differ from each other?
- How intensively are they used?
- Which phases of the product lifecycle (development, production, material purchasing, transportation, installation, maintenance) should you prioritize to maximize your impact on the safety, performance, effectiveness, and acceptance of your devices?
- Which suppliers cause the most problems?
- Which production facilities, which production processes, and which departments deliver the best outputs?
Tip 5: Collect data in early phases and evaluate it in good time
In order to answer these questions, you need to collect the necessary data (e.g., about suppliers, materials, and production facilities).
You should not start to think about this data only when the devices are on the market. Rather, an early and continuous evaluation is helpful and also required by ISO 13485, for example, in the context of process validation and monitoring.
Tip 6: Adjust sampling intervals
The intervals at which you collect and evaluate data should be variable.
1. The intervals should be dependent on the type and significance of the data (see Tab. 3).
2. The intervals should depend on the amount of data. As the amount of data increases, it is possible to perform evaluations and gain insights at shorter intervals.
3. The intervals should be in line with the risk that you may be able to capture or assess through this data.
Tip 7: Automate as much as possible
All of this assumes that you automate as many activities as possible:
- Collection of the data
- Processing the data (e.g., dealing with incorrect and missing data, conversions, categorizations, etc.)
- Analysis of the data, calculation of statistics and trends
- Alarming
- Report generation
Tip
Outsource diligence work to Johner Institute's post-market services. This allows you to benefit from economies of scale and focus on dealing with identified trends. You will achieve more for your company with less effort.
b) Avoid typical mistakes
During audits, technical documentation inspections, and (FDA) inspections, seven typical mistakes stand out that manufacturers should avoid.
Mistake 1: Not all devices considered
The obligations of manufacturers through MDR and IVDR apply to all devices. Manufacturers cannot invoke the transition periods. These have long since expired with regard to post-market surveillance.
Mistake 2: Too little data analyzed
Limiting data collection and analysis to customer complaints does not meet regulatory requirements:
- Manufacturers need to analyze other data sources (as presented in chapter 4 a)).
- Customer feedback (and not just customer complaints) contains information that manufacturers need to look at.
Even if manufacturers analyze multiple data sources, they may still miss trends if they do not collect and evaluate the necessary attributes.
Example
The analysis of the worldwide data does not reveal any problems with electrical safety. However, if the manufacturer had analyzed the data for different countries separately, he would have noticed that the number of broken insulations has been increasing in the USA for months.
Mistake 3: Post-market surveillance viewed as an isolated process
Post-market surveillance and data evaluation are processes that must interact closely with other processes (see Tab. 4).
Process | Interaction (examples) |
Risk management | Risk management serves as input for post-market surveillance (e.g., acceptance criteria). Conversely, PMS serves as input for risk management. |
Vigilance | Post-market surveillance provides the information to decide on and execute trend reporting in particular. |
Development | When determining what data is collected, the "design" of the device must be considered. For example, all SOUP defined in the development must be monitored. Conversely, static evaluation of post-market data provides valuable information on how to improve the design of the devices. |
Supplier Management | Manufacturers must specify the critical attributes of the supplied devices, materials and services. Whether these are fulfilled and sufficient to ensure the quality of the devices can be seen, among other things, in the evaluation of post-market data. |
Tab. 4: Examples of the interaction between the evaluation of post-market data and other processes
Mistake 4: Too large observation periods selected
More than one year of evaluation periods are usually not accepted by authorities and notified bodies. But even periods of up to one year can be too long for statistical evaluation and trend analysis: trends are detected too late (only after one year) or not at all (because they average out over the year).
Tip 6 (see above) helps to define suitable intervals.
Mistake 5: Competencies not ensured
Auditors easily embarrass manufacturers with the following questions:
- Where have you defined the competencies for creating the PMS plan?
- What competencies do the people who select and apply the statistical methods need?
- Where is the evidence that these competencies are in place?
Mistake 6: Systems not validated
Without computer support, the data can neither be collected nor evaluated in a meaningful way. Therefore, Excel, self-written scripts, ticket systems, and statistical programs are used.
All these are computerized systems (or parts of them), which are subject to the obligations of ISO 13485 according to computerized systems validation. Do you have these validation documents?
Note
Johner Institute is ISO-13485 certified and can provide validated post-market services and demonstrate the appropriate regulatory requirements.
Mistake 7: Wrong method and wrong application of the methods
The manufacturers make other mistakes when selecting and applying the methods:
- Many methods may only be used for normally distributed values. This requirement is often not fulfilled.
- Most methods may only be used on ratio and absolute scales but not on ordinal scales.
- Manufacturers make decisions based on regression lines but do not consider confidence levels. The statement that there is no trend is not very robust at a very low confidence level.
7. Summary and conclusion
Many manufacturers are not aware that they must report not only serious incidents but in certain cases also "statistically significant increases in the frequency or severity of non-serious incidents”.
Statistical evaluation and trend analysis, however, are more complex than most manufacturers realize. They are required by law and are under increasing review.
Therefore, manufacturers should dig deeper into the subject and build the necessary competencies.
Support from the Johner Institute
Avoid regulatory hassles, problems with unsafe devices, and unnecessary expenses. What helps: Outsource your post-market activities, such as post-market surveillance and regulatory monitoring.
Contact us right away with a proposed appointment for a free and non-binding meeting.
During this meeting, you can also clarify with the PMS experts of the Johner Institute how they can review your PMS plans and give you concrete advice for improvement. They will also support you in evaluating your data.

Author:
Andrea Seeck

Back To Top
Privacy settings
We use cookies on our website. Some of them are essential, while others help us improve this website and your experience.